Monday, May 25, 2015

Carnivale Royale

Here we go...time to make our own game.  At this point you should have done some thinking about your game and now be ready to start finalizing your design, testing your game, and building it.  We have three days to do this.  Here is what you will need:


Remember to look at some of the examples from the previous posting.

Here is a brief timeline that you should use for your planning purposes

BLOCK #1 (May 25)
  • Get partners
  • Look over project documents (above)
  • Decide on theme
  • Decide on game mechanics
  • Determine Theoretical Probability of Winning
  • Start Designing Poster
BLOCK #2 (May 27)
BLOCK #3 (May 29)
  • Bring Poster
  • Finish Theo vs. Exp reflection
  • Finish Building Game
If you have any questions, ask them via this blog post so that there is a running record of them for others to look at.

Thursday, May 21, 2015

Final Reflection and Game Planning

Yahoo...you just finished your final formal summative assessment.  All that is left is to design and build your carnival game.

Task #1: End of Year Reflection

After each unit, you have completed a Learning Behaviour Reflection.  Now I would like you to reflect on your entire year and think about the level of responsibility, organization, collaboration, and reflection that you have demonstrated as a math learner. Complete the survey below:


Task #2: Start Thinking About Your Game

Next class, we are going to start building our games. Before that time, you should start thinking about some ideas.  Remember that you are going to be with a partner so you will need to come up with a compromise.

Here are some things to consider:

  • Think about what game elements you want to use - coins, dice, spinners, cards, or marbles.
  • Your game should have two different actions to it. For example, you might flip a coin and spin a spinner OR you might pick 2 marbles from the same bag of marbles.
  • You should have a cool name and/or theme for your game.
Check out these examples of games that have met expectations and have been exemplary to give you some ideas of what students have done in the past:


Wednesday, May 13, 2015

Advanced Sample Spaces

Focus Questions:

  • How can we analyze compound events in a more efficient way?
  • What effect does replacement have on probability
Do Now:
To win this game, you must pick a green marble out of each bucket.  What is the probability of winning this game? Use a sample space to show your work.


Part 1: A Question of Replacement

In this part of the lesson, we will explore what effect replacing the first block chosen from a bag has on the probability of getting a matching pair of red blocks.  Here is what you will need:
  • A bag with four blocks - 2 RED, 1 BLUE, and 1 YELLOW
Game #1:
  • Pick 1 block from the bag, put it back in the bag, and then draw a second block.
  • If both blocks are RED - you win.
  • Repeat this 20 times and record how many times you win.

Game #2:
  • Pick 1 block from the bag, do NOT put it back in the bag, and then draw a second block.
  • If both blocks are RED - you win.
  • Repeat this 20 times and record how many times you win.
Record your results in this form.


Part 2: Advanced Sample Spaces

In this part of the lesson, we will look at how we can use a more advanced form of tables and tree diagrams to help us analyze a greater variety of events with more efficiency.  Here is what you will need to do:
  • Create a SAMPLE SPACE to show all of the outcomes for both experiment #1 and experiment #2.  Be careful with experiment #2 - it is tricky.

NOTE TAKING - What we want to do is be able to use a more efficient version of our sample spaces that focuses on the relative frequency of each different type of outcome as opposed to representing each "equally likely" outcome.  We will try some of these together as a class.  Here is an example of a more advanced "table" and a more advanced "tree diagram":

Part 3: Making Money

In this part of the money we will begin to take a look at how to decide whether a game will make money at a carnival. We will continue to explore this next class.


Here is another version of making purple. Do you expect the school to make money playing this game? Justify your answer.


Here is what you MUST do before next class:
  • ACE (1-4, 8)

Monday, May 11, 2015

3.1 Designing Another Spinner

Focus Question:
How can we use a probability simulation to make predictions?

Part 1: Looking At Spinners


Part 2: Analyzing a Spinner

Kalvin decides to use the spinner shown below:

  1. What is the theoretical probability that the spinner will land on each time?
  2. Based on the theoretical probabilities, if Kalvin spins the spinner 64 times, about how many times can he expect to go to bed at each time? Explain. Why do you think I chose 64 times?

Part 3: Testing the Spinner

  1. Go to the following website: Spinner Site (you will probably need to use Firefox or Safari)
  2. Click on "Change Spinner"
  3. Design your spinner.
  4. What was the experimental probability that the spinner landed on each time?
  5. How many times did you "spin" the spinner? How did you decide that you had enough trials?
  6. How do your experimental results compare to your theoretical probabilities?

Part 4: Designing a New Spinner

Pretend that you are Kalvin's father.  Design a new spinner where it is "most likely" that Kalvin will go to bed at 9:00. Your spinner must have at least three different times and four different sections.
  1. Test your spinner to be sure that it meets the criteria.
  2. Take a screen shot and post it on your blog along with the theoretical probability of Kalvin going to bed at each time.

Scratching Spots:


  • How might we design a simulation to test the probability of winning this contest?
  • Try to use one of the probability tools to design a simulation for this situation. Be prepared to share your idea with others.
  1. Based on your simulation, what is the experimental probability of winning this game?
  2. Build a sample space to try and determine the theoretical probability of winning this game?
  3. Is it worth it to spend $1000 at Tawanda's Toys to try and win video games?  Explain.

Homework:

Tuesday, May 5, 2015

Analyzing Compound Events

Focus Questions:
  • How can you decide if a game is fair or not?
  • How can we determine the theoretical probability of a compound event?
New Vocabulary:
  • Fair Game - a game where the winning and losing are "equally likely"
  • Sample Space - a list of all of the possible outcomes for an event.
  • Tree Diagram - One type of "sample space" that is useful for events that have more than two parts.
  • Compound Event - An event that has two or more parts or actions

Part 1: The Coin Game

Here are the rules of this game:
  • You will toss three coins.
  • If all three of the coins match, you get a point (and some money).
  • If all three of the coins do NOT match, I get a point.
  • Everybody gets one turn.
  • At the end, the team (students or teacher) with the most points wins.

Part 2: Analzying the Game

  1. What is the "experimental probability" of having all three coins match?
  2. How many outcomes are there in this game?
  3. Draw a sample space to determine all of the outcomes. (which type of sample space should you draw?)
  4. Is this a "fair game"? Explain why or why not.

Part 3: The Bonus Prize

You are a contestant on Gee Whiz Everybody Wins and have made it to the final "Bonus Round".  In the Bonus Round you get to choose one of two games to play.

Game #1
  • How to Play - Choose a block from Bag #1 THEN Choose from Bag #2
  • How to Win - If you correctly predict the color of block that you will choose from each bag, you win.
Game #2
  • How to Play - Choose a block from Bag #1 AND Bag #2 at the same time.
  • How to Win - If you correctly predict the color combination that you will choose, you win.

Which game should you play?  Justify your decision with experimental and theoretical probabilities.

Part 4: Playing The Game

Task A:

  • Run each experiment 18 times.  Record the results in your table.  Please remember to treat the bags kindly as they need to be used in multiple classes.
  • After you have completed your experiment, fill out the forms below to contribute to class data.
  • Here are the results from our class data: 


Part 5: Analyzing the Experiment

Answer the following questions in your squarebook:
  1. What is the "experimental probability" of choosing each outcome for Game #1? Game #2?
  2. What is the "theoretical probability" of choosing each outcome for Game #1? Game #2?
  3. Are all of the outcomes "equally likely" for Game #1? Game #2?
  4. How do the "experimental probabilities" and the"theoretical probabilities" compare for Game #1? Game #2?
  5. Which Game should you choose to play? What should you predict if you play this game?

By the end of this lesson, you should be able to do the following:

  • Determine whether a game is "fair".
  • Describe how a "compound event" is different from a "simple event"
  • Determine the "sample space" for a compound event using a probability tool such as a tree diagram or table

Homework:

  1. ACE (9,11,12) (26) (*38)
  2. Mid-Unit Summative on Investigations 1 and 2 next class.


Thursday, April 30, 2015

Battle of the Sums

Focus Questions:


What does it mean for a game to be “fair”?
How can we determine whether a game is in fact “fair”


Part 1: Battle of the Sums (30 min)
For this lesson we are going to be playing a couple of different games and then analyzing the games.  The first game that we are going to play is called “Battle of the Sums”


After the game is played, make a tally of how many times Player A won vs Player B. Do you think that this is a "Fair Game"?


Part 2: Rolling Dice
For this part of the lesson, we are going to explore the "relative frequency" for each sum when we roll two dice. You will need to make the following table in your squarebook.


2
3
4
5
6
7
8
9
10
11
12
Tally


Total


Now, roll a pair of dice 36 times and keep track of how many times each sum is rolled. record this in the table.

When you are finished, add your data to this form

Check out the results here:


Part 3: Redesign the Game. (10 min)
Have students propose a more “fair” version of the game they just played.  There are a lot of ways to do it.  Some will try to say things like (roll only one die, ignore sums of 7 etc.)  Tell students that they challenge is to assign EVERY possible sum to one of the players.


Part 4: Sample Spaces. (10 min)
Watch the video below on "sample spaces". This will be a major focus of what we do next class as a way to "represent" probability.

Homework:

  • Students may need to finish the game at home.
  • Give students the “Sample Spaces” handout and tell them to watch the video at home.

Monday, April 27, 2015

Choosing Marbles

Focus Question: 

How do we determine the theoretical probability of some slightly more complex situations.

New Vocabulary:

  • AND - All conditions described must be met.
  • OR - Only one of the conditions described need to be met.
  • NOT - The conditions listed must NOT occur.

Part 1: More Kalvin

For this part of the lesson you are going to do a quick formative assessment to see how well you understand the main focus questions from last week's lessons on probability.

You will do the assessment independently and can use calculators if you think that you need them.

Part 2: Simple Events

In this part of the lesson you will watch a video describing some of the basics around finding the theoretical probability of an outcome for a given event.  We have already talked about this a little bit, so this should be mostly a reinforcement of prior knowledge.


When you have finished watching the video, make sure that you complete the "On Your Own" questions.  Show your teacher when you have finished the questions.

Part 3: Choosing Marbles - Determining Theoretical Probabilities

The main part of this lesson is for you to now practice applying the concept of theoretical probability.  This is also in your textbook on page 30.


By the end of this problem you should be able to do the following:

  • Determine the theoretical probability for a series of outcomes that contain the "OR", "AND", and "NOT" conditions.
  • Develop a probability situation based on theoretical probabilities.

Homework:

  1. ACE (p. 36) (6-7) (18-25)

Friday, April 24, 2015

Choosing Cereal

Focus Questions: 

  • How does collecting more data helps you to predict the outcome of a probability situation?
  • How can we use the results of a probability experiment to determine the "relative frequency" of an outcome?
  • How does running a probability experiment help you determine how many possible outcomes there are as well as the likelihood of each outcome?

Kalvin would prefer to eat Cocoa Blast cereal for breakfast everyday.  His parents would prefer that he eats Health Nut Flakes.  In order to decide, his mother allows Kalvin to design a probability experiment.

    Option 1: Flipping Coins

    Kalvin will flip a coin.  If the results are heads, he will eat Cocoa Blast.  If the results are tails, he will eat Health Nut Flakes.

    1. To run this experiment we will use our integer counters.  With your partner, designate one color to be "Heads" and the other color to be "Tails".  Make a note of your legend at the top of the table.
    2. After you have completed your experiment, fill out this online form to contribute your data to our class data.
    3. Here are the class results:

      RED = HEADS and BLUE = TAILS

      Option 2: Tossing Cups

      Kalvin will toss a cup.  If the cup lands on either end, he will eat Cocoa Blast.  If the cup lands on its side, he will eat Health Nut Flakes.


      • Run your experiment 20 times.  Record the results in your table.  Please remember to treat the cups kindly as they need to be used in multiple classes.
      • After you have completed your experiment, fill out this online form to contribute to the class data.  Here are the results of the class data:

      Option 3: Matching Coins

      Kalvin will toss two coins.  If the coins match, he will eat Cocoa Blast.  If the coins do NOT match he will eat Health Nut Flakes.

      1. Run your experiment 30 times.  Record the results in your table.  Remember to use the "shake and drop" strategy.  
      2. After you have completed your experiment, fill out this online form to contribute to the class data.  Here are the results of the class data:

      At the end of this Problem you should be able to do the following:

      • Describe how the accuracy of a probability experiment is influenced by the amount of data collected.
      • Describe the difference between the probability of each outcome for an event and the relative frequency of each outcome for a probability experiment.
      • Use the results of a probability experiment in order to predict the likelihood of each outcome.
      • Extend the results of a probability experiment in order to predict the results of a similar probability experiment.

      Here is what you MUST do before next class:

      Wednesday, April 22, 2015

      Gee Whiz Everybody Wins - Blocks C and E

      Focus Questions:
      1. What does it mean if outcomes are equally likely?
      2. How do I determine the theoretical and experimental probabilities for an event?
      Part 1: Gee Whiz Everybody Wins

      Let's play a game!  The rules for this game are very simple:
      • Guess what color of block you are going to pick.
      • If you are correct you win, if not you lose.
      • Questions???

      What do you think is in the bag?  How did you decide this?

      Part 2: Equally Likely

      Outcomes are said to be equally likely if the probability of each outcome is the same.  Take a look at the two spinners below and try to decide which one shows outcomes that are equally likely:


      Now...take a look at the different situations below and try to decide whether the outcomes listed are equally likely.  Be prepared to defend your choices as this gets tricky:


      Part 3: Theoretical and Experimental Probabilities

      As you saw in the video, theoretical probability is a probability that is calculated by examining all of the possible outcomes for an event.  Experimental probability is calculated from the results of an experiment.

      We typically write this as a ratio, a decimal, or a percentage.  The two things you need to pay close attention to are the total number of outcomes and then how many of those outcomes are "favorable".

      Answer the following questions based on Gee Whiz Everybody Wins:
      1. What was the experimental probability of picking each color?  Be sure to use "probability notation".
      2. What was the theoretical probability of picking each color?  Be sure to use "probability notation".
      Here is what you MUST do before next class:

      • ACE (11-15) p. 19
      • ACE (1-2) p. 36


      Monday, April 20, 2015

      Introduction to Probability - Block G

      Our next unit is my personal favorite - Probability.  This is a unit where we get to explore "how likely" is something to happen.  This is a great skill to have in anybody's decision making skill set.

      First of all, let's start by playing a game.  The rules are very simple:

      • Predict what you will pick out of the bag.
      • If you are correct, you win
      • Questions???


      Next, let's get a sense of what you will be doing in this unit.  Take a look at the "I Can..." statements.  On the scale above each statement, place a mark to indicate how well you think you can do each of the unit objectives.  Remember that this is the beginning of the unit so I am not expecting you to be an expert.


      Now...let's get some basic probability language down.  Take a look at this video and complete the note-taking sheet that you have been provided with.


      Here are some key words that you should be able to use next class:

      • Event
      • Outcome
      • Certain
      • Impossible
      • Likely
      • Unlikely
      • Theoretical Probability
      • Experimental Probability

      What does it mean if outcomes are "Equally Likely"?

      If two or more outcomes are "equally likely", it means that they have an equal chance of occurring.  Think about the game we just played.  Each block had an equally likely chance of being picked, but that didn't necessarily mean that each color had an "equally likely" chance of being picked.

      Take a look at the spinners below and see if you can decide which one has "equally likely" outcomes.  Be prepared to justify your answer:


      Now let's look at a variety of other events.  For each event, list all of the possible outcomes (if this hasn't already been done for you) and then decide whether the outcomes are all "equally likely" to occur.


      As you can see, this can get a little bit tricky.

      Now let's Practice

      I have included a link to a Khan Academy activity that addresses the same things that are discussed in the video above.  You need to complete this before next class: Understanding Probability

      Before next class you MUST have completed the following:
      • Self assess your current level of understanding of each "I can..." statement
      • Watch the "What is Probability" video and complete the note-taker page.
      • Pass the first level of the "Understanding Probability" exercise on Khan Academy
      • ACE (11-18) p. 19
      • ACE (26-29) p. 23

      Introduction to Probability - Block C and E

      Our next unit is my personal favorite - Probability.  This is a unit where we get to explore "how likely" is something to happen.  This is a great skill to have in anybody's decision making skill set.

      First of all, let's get a sense of what you will be doing in this unit.  Take a look at the "I Can..." statements.  On the scale above each statement, place a mark to indicate how well you think you can do each of the unit objectives.  Remember that this is the beginning of the unit so I am not expecting you to be an expert.


      Now...let's get some basic probability language down.  Take a look at this video and complete the note-taking sheet that you have been provided with.


      Here are some key words that you should be able to use next class:

      • Event
      • Outcome
      • Certain
      • Impossible
      • Likely
      • Unlikely
      • Theoretical Probability
      • Experimental Probability

      Now let's Practice

      I have included a link to a Khan Academy activity that addresses the same things that are discussed in the video above.  You need to complete this before next class: Understanding Probability

      Before next class you MUST have completed the following:

      • Self assess your current level of understanding of each "I can..." statement
      • Watch the "What is Probability" video and complete the note-taker page.
      • Pass the first level of the "Understanding Probability" video on Khan Academy

      Tuesday, April 14, 2015

      What Does it "Mean" to be Normal?

      Focus Questions:

      How do we determine what is "normal" for a given parameter?
      What are some ways that we can compare the same data for two different samples?

      Part 1: Interpreting Box Plots

      The main focus for this part of the lesson is to look at how we can use a boxplot to determine what is "normal" for a set of data.

      As a reminder, here is the general structure of a box plot:


      Remember that there are two main things to keep in mind:

      1. Each section of the box plot represents 25% of your sample (or in other words, if your sample was 100 people, each section represents the data for 25 people)
      2. Each section represents the "range in data" for that 25% of the sample.  This is why the sections are different sizes, some sections of your sample have more "variability' (spread) than others.
      Speaking of Variability....

      There are a couple of ways that you can determine the variability of your data.  Variability refers to how similar your results are.  Generally speaking, the lower the variability, the more confident you can be that the results of your sample can be used to make predictions about your population.

      So...strategies for determining variability:
      1. Calculate the Range and Interquartile Range (IQR) - if you are comparing two sets of data from the same parameter, the data set that has the LOWER range and IQR is probably more reliable.
      2. Look at the Box Plot - box plots that have less variability tend to have longer whiskers and shorter boxes.
      Look at the box plots below.  Which set of data do you think has the least variability?


      Hopefully, you selected "Seattle".  This is because if I look visually, all of the box plots are about the same as they all have shorter whiskers. But, if I calculate the range and IQR, I can see that the weather is Seattle is less variable.

      Part 2: Determining what is "Normal"

      Statistically speaking, there are three different ways we can determine what is "normal".  These are tools that you have used in the past:
      1. Mean - add all of the numbers up and divide by the sample size (this is not shown on a box plot)
      2. Median - put all the numbers in increasing order and find the number in the middle (this is shown on a box plot)
      3. Mode - find the most common number (or categorical response)
      Since there are a variety of ways to decide what is "normal", we need to decide when we should be using each one.  Here is a little guide for your data analysis pleasure:

      • STEP 1: Decide what type of "parameter" you have:
        • if it is categorical, use the MODE
        • if it is quantitative, go to STEP 2
      • STEP 2: Make a box plot of your data and analyze the general shape of the box plot:
        • if it is generally symmetrical, use the MEAN
        • if it is generally "skewed", use the MEDIAN
      So...how do you know if your data is SKEWED?

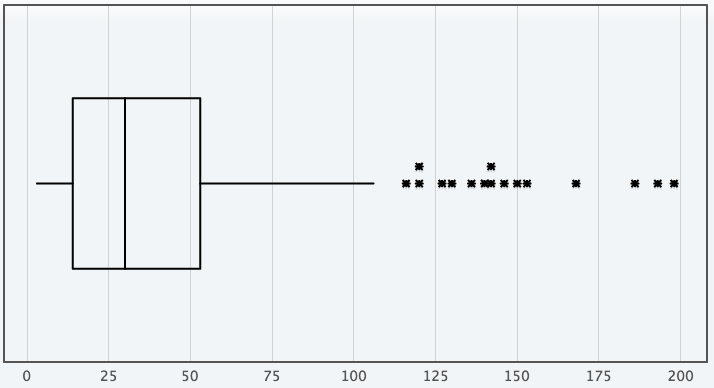
      Data is skewed (not symmetrical) when we have data that is highly variable.  The main reason for this high variance is the presence of "outliers" which are shown as a * on the box plot.  Outliers cause the overall box plot to change its shape.  So look for the following clues that your data is skewed:
      1. You have some outliers
      2. One whisker is much longer than the other
      3. The box is shifted far to the left or right.
      Look at the example below to see what a "skewed" box plot might look like.


      Part 3: Talking the Talk

      Next class you will be analyzing the entire set of male and female data from our 7th grade census.  As you work through the data, try to answer the following questions as you go:

      • Are you analyzing the results of a census or a survey?
        • If it is a census, what is the population?
        • If it is a survey, what is the population? what is the sample? what sampling strategy did you use? how do you know that it is representative (unbiased)?
      • What parameter are you currently analyzing?
      • Is it a quantitative or categorical parameter?  How do you know?
      • What did you decide was "normal" for this parameter?
        • Is your data skewed or symmetrical?  How do you know?
        • What measure of normal (mean, median, mode) should you use?
        • Why did you choose this one?
      What you MUST do before next class:
      1. Read this blog post at least two times before next class.
      2. Complete the practice page handed out in class.

      Friday, April 10, 2015

      Making Random Samples and Asking Statistical Questions

      Focus Questions:

      How do I make a random sample?
      How do I ask a "statistical question"?
      How big should my random sample be?

      Part 1: Making Random Samples

      In this part of the lesson, we are going to look at some different strategies for making random samples.

      Consider this question:

      Mr. Ray wants to give chocolate to three randomly selected students.  How could he do this in an "unbiased way"?

      Our student data form has almost 300 entries, so some of the strategies that were suggested, might not work as efficiently.  So, we will use a random number generator to do the hard work for us.  In order to do this, you will need your own copy of the "Samples and Populations - Student Information Responses"

      • Click on the following link: Samples and Populations - Study Copy
      • Make a copy of the form and rename it so that is says "Samples and Populations - YOUR NAME Copy"
      • File it in an appropriate place in your GoogleDrive.
      We are now going to generate 6 different random samples as indicated on the spreadsheet.

      Part 2:  Asking Statistical Questions

      In this part of the lesson we are going to start asking statistical questions that we can use our data to help us answer.  When asking these questions, we need to keep in mind a couple of things:
      • What is the population in which you are interested.
      • Do you want to find out about one population or would you like to compare populations.
      Here are some examples:
      • Are 7th grade boys are statistically taller than 7th grade girls?
      • Do girls on B-side have statistically more Facebook friends than girls on C-side?
      Part 3: Comparing Sample Sizes

      One question that has come up a lot in our class is how big should a sample be?  That is a great question.  Here is what we are going to do:
      • As a class, we will choose one quantitative "parameter" to focus on.  Examples could be height, shoe size, number of siblings, age etc.
      • Find the mean for each of your random samples of your given gender.
      • Place a sticker on the number line to represent the mean for your sample size.
      Here is what you MUST do before next class:
      • Complete your random samples of both boys and girls.
      • ACE (15, 16, 17, 19)
      • We will do the survey as a "Do Now" next class.


      Wednesday, April 8, 2015

      Drawing Conclusions From Samples

      Focus Questions:

      How can we use the results of a survey to make inferences about a population?
      What are some strategies that we can use to improve the accuracy of our inferences?

      Part 1:

      Part 2: Taking a Survey.  Please complete the following survey about honesty.


      Tuesday, March 31, 2015

      Filling and Wrapping End of Unit Assessment

      WELCOME BACK - I have missed you!

      Objective: the main goal for today is for you to be able to show your understanding of what volume and surface area and make the connection between those two measurements and your previous understanding of area and perimeter.

      Part 1: End of Unit Assessment

      A couple of friendly reminders before the assessment:

      • You can use a calculator, but remember to show your work.
      • Remember to include your units.
      • Remember that ideas are always better than rules.  If you get stick try to focus on the big ideas for this unit.

      Part 2: Filling and Wrapping Learning Behaviours

      As the unit is now "wrapped-up".  Take the time to complete the Learning Behaviours self-reflection form found below.

      Learning Behaviours Self-Reflection Form

      Part 3: Getting Ready For the Next Unit

      Our next unit is going to have us focus on analyzing data in a variety of different ways.  In order to add a little of personal interest to this, we are going to collect some data on ourselves.  So, please complete the following form.  Make sure that you read the questions very carefully.

      Grade 7 Student Data Form

      Here is what you MUST do before next class:

      • Complete the two forms that are linked above.
      • Bring your Filling and Wrapping textbook to class.

      Monday, February 2, 2015

      Thursday, January 29, 2015

      Mid-Unit Assessment Day

      The main goal for today was to give everybody a chance to demonstrate their learning so far this unit on our mid-unit assessment.

      Part 1:  Do Now


      • Use DESMOS to make a graph that shows the price plan for each of the three different DJ's.  Think carefully about how to set the values for the x and y axes.
      • Write a question that you could answer by looking at the graph.
      Part 2: Mid-Unit Assessment

      As you do the assessment remember to think about the connection between tables, graphs, and equations as well as how to determine the rate of change and the starting value using each representation.

      Part 3: Swipe, Split, Flip

      This is a fun logic game that we will play today.  If you need a review of the objective and the rules, watch the slideshow below:


      What you MUST do before next class:
      • Complete all Swipe, Split, Flip challenges.  Remember to do the following:
        • Draw a picture of your "solution".
        • Briefly record your steps.
        • Glue the pages in your workbook.

      Thursday, January 22, 2015

      2.3 More Comparing Relationships

      Focus question:

      How can we decide if a table, graph, or equation represents a linear relationship?  What does it mean when two linear relationships intersect?

      Part 1: Do Now

      1. Have your two screenshots from last class ready on your computer.  We will have one person share their "triangle graph" and one person share their "non-triangle graph".  Be prepared to share your thinking.
      2. Complete the "Linear Relationships Matching Activity".  For each story you need to do the following:
        • As you read the story try to decide what the "rate of change" and "starting position" are.
        • Determine which table goes with the story.
        • Determine which graph goes with the story.
        • Write an equation in y = mx + b format using the rate of change and starting value for the story.
      Part 2:  Vocabulary

      This lesson introduces some even more formal math vocabulary that mathematicians use when describing linear relationships.  These words are:
      • y-intercept
      • coefficient
      • solution
      Read through your textbook with your table group from page 32-33 and complete the note table.  Glue this into your notebook.

      Part 3: Comparing Costs

      In this part of the lesson you are going to continue the work from last class where we are going to look at the pricing plans for three different T-shirt companies and try to decide when each company represents the better value.  Remember that when looking at a linear relationship the two most important things to identify are the STARTING VALUE and the RATE OF CHANGE.

      Here is what you MUST do before next class:

      Wednesday, January 21, 2015

      2.1 and 2.2 Comparing Relationships

      Focus Question: 
      How can we use tables, graphs, and equations to compare linear relationships?

      Part 1:
      In this lesson, we are going to focus on how to use different representations in order to determine the distance were two brothers meet in a race.

      Here is the set-up:

      Henri challenges his older brother Emile to a race.  Because Emile’s walking rate is faster, Emile gives Henri a 45-meter head start.  Emile wants the race to end in a tie.

      What distance should the race be so that the race ends in a tie?


      In order to better understand how we can use the various representations to help us tackle this problem, work through the attached activity.

      Here is what you MUST do before next class:
      • Finish parts 2 & 3 of the attached activity (Block E only)
      • ACE (2,3) p. 38
      • Desmos HW: 
        • Discover three equations whose graphs will intersect to form a triangle.  Take a screenshot of your graph and equations.
        • Discover three equations whose graphs will NOT intersect to form a triangle.  Take a screenshot of your graph and equations.