Wednesday, April 22, 2015

Gee Whiz Everybody Wins - Blocks C and E

Focus Questions:
  1. What does it mean if outcomes are equally likely?
  2. How do I determine the theoretical and experimental probabilities for an event?
Part 1: Gee Whiz Everybody Wins

Let's play a game!  The rules for this game are very simple:
  • Guess what color of block you are going to pick.
  • If you are correct you win, if not you lose.
  • Questions???

What do you think is in the bag?  How did you decide this?

Part 2: Equally Likely

Outcomes are said to be equally likely if the probability of each outcome is the same.  Take a look at the two spinners below and try to decide which one shows outcomes that are equally likely:


Now...take a look at the different situations below and try to decide whether the outcomes listed are equally likely.  Be prepared to defend your choices as this gets tricky:


Part 3: Theoretical and Experimental Probabilities

As you saw in the video, theoretical probability is a probability that is calculated by examining all of the possible outcomes for an event.  Experimental probability is calculated from the results of an experiment.

We typically write this as a ratio, a decimal, or a percentage.  The two things you need to pay close attention to are the total number of outcomes and then how many of those outcomes are "favorable".

Answer the following questions based on Gee Whiz Everybody Wins:
  1. What was the experimental probability of picking each color?  Be sure to use "probability notation".
  2. What was the theoretical probability of picking each color?  Be sure to use "probability notation".
Here is what you MUST do before next class:

  • ACE (11-15) p. 19
  • ACE (1-2) p. 36


Monday, April 20, 2015

Introduction to Probability - Block G

Our next unit is my personal favorite - Probability.  This is a unit where we get to explore "how likely" is something to happen.  This is a great skill to have in anybody's decision making skill set.

First of all, let's start by playing a game.  The rules are very simple:

  • Predict what you will pick out of the bag.
  • If you are correct, you win
  • Questions???


Next, let's get a sense of what you will be doing in this unit.  Take a look at the "I Can..." statements.  On the scale above each statement, place a mark to indicate how well you think you can do each of the unit objectives.  Remember that this is the beginning of the unit so I am not expecting you to be an expert.


Now...let's get some basic probability language down.  Take a look at this video and complete the note-taking sheet that you have been provided with.


Here are some key words that you should be able to use next class:

  • Event
  • Outcome
  • Certain
  • Impossible
  • Likely
  • Unlikely
  • Theoretical Probability
  • Experimental Probability

What does it mean if outcomes are "Equally Likely"?

If two or more outcomes are "equally likely", it means that they have an equal chance of occurring.  Think about the game we just played.  Each block had an equally likely chance of being picked, but that didn't necessarily mean that each color had an "equally likely" chance of being picked.

Take a look at the spinners below and see if you can decide which one has "equally likely" outcomes.  Be prepared to justify your answer:


Now let's look at a variety of other events.  For each event, list all of the possible outcomes (if this hasn't already been done for you) and then decide whether the outcomes are all "equally likely" to occur.


As you can see, this can get a little bit tricky.

Now let's Practice

I have included a link to a Khan Academy activity that addresses the same things that are discussed in the video above.  You need to complete this before next class: Understanding Probability

Before next class you MUST have completed the following:
  • Self assess your current level of understanding of each "I can..." statement
  • Watch the "What is Probability" video and complete the note-taker page.
  • Pass the first level of the "Understanding Probability" exercise on Khan Academy
  • ACE (11-18) p. 19
  • ACE (26-29) p. 23

Introduction to Probability - Block C and E

Our next unit is my personal favorite - Probability.  This is a unit where we get to explore "how likely" is something to happen.  This is a great skill to have in anybody's decision making skill set.

First of all, let's get a sense of what you will be doing in this unit.  Take a look at the "I Can..." statements.  On the scale above each statement, place a mark to indicate how well you think you can do each of the unit objectives.  Remember that this is the beginning of the unit so I am not expecting you to be an expert.


Now...let's get some basic probability language down.  Take a look at this video and complete the note-taking sheet that you have been provided with.


Here are some key words that you should be able to use next class:

  • Event
  • Outcome
  • Certain
  • Impossible
  • Likely
  • Unlikely
  • Theoretical Probability
  • Experimental Probability

Now let's Practice

I have included a link to a Khan Academy activity that addresses the same things that are discussed in the video above.  You need to complete this before next class: Understanding Probability

Before next class you MUST have completed the following:

  • Self assess your current level of understanding of each "I can..." statement
  • Watch the "What is Probability" video and complete the note-taker page.
  • Pass the first level of the "Understanding Probability" video on Khan Academy

Tuesday, April 14, 2015

What Does it "Mean" to be Normal?

Focus Questions:

How do we determine what is "normal" for a given parameter?
What are some ways that we can compare the same data for two different samples?

Part 1: Interpreting Box Plots

The main focus for this part of the lesson is to look at how we can use a boxplot to determine what is "normal" for a set of data.

As a reminder, here is the general structure of a box plot:
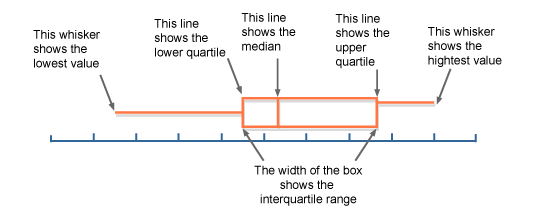


Remember that there are two main things to keep in mind:

  1. Each section of the box plot represents 25% of your sample (or in other words, if your sample was 100 people, each section represents the data for 25 people)
  2. Each section represents the "range in data" for that 25% of the sample.  This is why the sections are different sizes, some sections of your sample have more "variability' (spread) than others.
Speaking of Variability....

There are a couple of ways that you can determine the variability of your data.  Variability refers to how similar your results are.  Generally speaking, the lower the variability, the more confident you can be that the results of your sample can be used to make predictions about your population.

So...strategies for determining variability:
  1. Calculate the Range and Interquartile Range (IQR) - if you are comparing two sets of data from the same parameter, the data set that has the LOWER range and IQR is probably more reliable.
  2. Look at the Box Plot - box plots that have less variability tend to have longer whiskers and shorter boxes.
Look at the box plots below.  Which set of data do you think has the least variability?


Hopefully, you selected "Seattle".  This is because if I look visually, all of the box plots are about the same as they all have shorter whiskers. But, if I calculate the range and IQR, I can see that the weather is Seattle is less variable.

Part 2: Determining what is "Normal"

Statistically speaking, there are three different ways we can determine what is "normal".  These are tools that you have used in the past:
  1. Mean - add all of the numbers up and divide by the sample size (this is not shown on a box plot)
  2. Median - put all the numbers in increasing order and find the number in the middle (this is shown on a box plot)
  3. Mode - find the most common number (or categorical response)
Since there are a variety of ways to decide what is "normal", we need to decide when we should be using each one.  Here is a little guide for your data analysis pleasure:

  • STEP 1: Decide what type of "parameter" you have:
    • if it is categorical, use the MODE
    • if it is quantitative, go to STEP 2
  • STEP 2: Make a box plot of your data and analyze the general shape of the box plot:
    • if it is generally symmetrical, use the MEAN
    • if it is generally "skewed", use the MEDIAN
So...how do you know if your data is SKEWED?

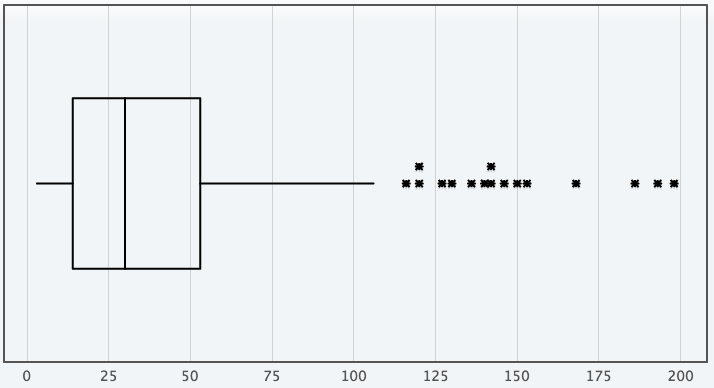
Data is skewed (not symmetrical) when we have data that is highly variable.  The main reason for this high variance is the presence of "outliers" which are shown as a * on the box plot.  Outliers cause the overall box plot to change its shape.  So look for the following clues that your data is skewed:
  1. You have some outliers
  2. One whisker is much longer than the other
  3. The box is shifted far to the left or right.
Look at the example below to see what a "skewed" box plot might look like.


Part 3: Talking the Talk

Next class you will be analyzing the entire set of male and female data from our 7th grade census.  As you work through the data, try to answer the following questions as you go:

  • Are you analyzing the results of a census or a survey?
    • If it is a census, what is the population?
    • If it is a survey, what is the population? what is the sample? what sampling strategy did you use? how do you know that it is representative (unbiased)?
  • What parameter are you currently analyzing?
  • Is it a quantitative or categorical parameter?  How do you know?
  • What did you decide was "normal" for this parameter?
    • Is your data skewed or symmetrical?  How do you know?
    • What measure of normal (mean, median, mode) should you use?
    • Why did you choose this one?
What you MUST do before next class:
  1. Read this blog post at least two times before next class.
  2. Complete the practice page handed out in class.

Friday, April 10, 2015

Making Random Samples and Asking Statistical Questions

Focus Questions:

How do I make a random sample?
How do I ask a "statistical question"?
How big should my random sample be?

Part 1: Making Random Samples

In this part of the lesson, we are going to look at some different strategies for making random samples.

Consider this question:

Mr. Ray wants to give chocolate to three randomly selected students.  How could he do this in an "unbiased way"?

Our student data form has almost 300 entries, so some of the strategies that were suggested, might not work as efficiently.  So, we will use a random number generator to do the hard work for us.  In order to do this, you will need your own copy of the "Samples and Populations - Student Information Responses"

  • Click on the following link: Samples and Populations - Study Copy
  • Make a copy of the form and rename it so that is says "Samples and Populations - YOUR NAME Copy"
  • File it in an appropriate place in your GoogleDrive.
We are now going to generate 6 different random samples as indicated on the spreadsheet.

Part 2:  Asking Statistical Questions

In this part of the lesson we are going to start asking statistical questions that we can use our data to help us answer.  When asking these questions, we need to keep in mind a couple of things:
  • What is the population in which you are interested.
  • Do you want to find out about one population or would you like to compare populations.
Here are some examples:
  • Are 7th grade boys are statistically taller than 7th grade girls?
  • Do girls on B-side have statistically more Facebook friends than girls on C-side?
Part 3: Comparing Sample Sizes

One question that has come up a lot in our class is how big should a sample be?  That is a great question.  Here is what we are going to do:
  • As a class, we will choose one quantitative "parameter" to focus on.  Examples could be height, shoe size, number of siblings, age etc.
  • Find the mean for each of your random samples of your given gender.
  • Place a sticker on the number line to represent the mean for your sample size.
Here is what you MUST do before next class:
  • Complete your random samples of both boys and girls.
  • ACE (15, 16, 17, 19)
  • We will do the survey as a "Do Now" next class.


Wednesday, April 8, 2015

Drawing Conclusions From Samples

Focus Questions:

How can we use the results of a survey to make inferences about a population?
What are some strategies that we can use to improve the accuracy of our inferences?

Part 1:

Part 2: Taking a Survey.  Please complete the following survey about honesty.


Tuesday, March 31, 2015

Filling and Wrapping End of Unit Assessment

WELCOME BACK - I have missed you!

Objective: the main goal for today is for you to be able to show your understanding of what volume and surface area and make the connection between those two measurements and your previous understanding of area and perimeter.

Part 1: End of Unit Assessment

A couple of friendly reminders before the assessment:

  • You can use a calculator, but remember to show your work.
  • Remember to include your units.
  • Remember that ideas are always better than rules.  If you get stick try to focus on the big ideas for this unit.

Part 2: Filling and Wrapping Learning Behaviours

As the unit is now "wrapped-up".  Take the time to complete the Learning Behaviours self-reflection form found below.

Learning Behaviours Self-Reflection Form

Part 3: Getting Ready For the Next Unit

Our next unit is going to have us focus on analyzing data in a variety of different ways.  In order to add a little of personal interest to this, we are going to collect some data on ourselves.  So, please complete the following form.  Make sure that you read the questions very carefully.

Grade 7 Student Data Form

Here is what you MUST do before next class:

  • Complete the two forms that are linked above.
  • Bring your Filling and Wrapping textbook to class.